Market Outlook
November 02, 2017
Market Cues
Domestic Indices
Chg (%)
(Pts)
(Close)
Indian markets are likely to open negative tracking global indices and SGX Nifty.
BSE Sensex
1.2
387
33,600
U.S. markets closed mostly higher on Wednesday after the Federal Reserve kept
Nifty
1.0
105
10,441
interest rates unchanged. The S&P 500 finished 0.16 percent higher at 2,579.36,
Mid Cap
0.4
59
16,647
with energy leading advancers.
Small Cap
0.5
97
17,697
The European markets ended Wednesday's session in the green. The German DAX
Bankex
2.0
569
28,853
rallied after investors returned to action following yesterday's public holiday. Traders
were encouraged by positive economic data from both China and the United States.
Global Indices
Chg (%)
(Pts)
(Close)
Chinese manufacturing data provided a boost to shares of mining stocks.
Dow Jones
0.2
58
23,435
Indian markets rose sharply to close at fresh record highs on Wednesday as
Nasdaq
(0.2)
(11)
6,717
encouraging core sector output data stoked optimism about the economy and the
FTSE
(0.1)
(5)
7,488
World Bank's Doing Business 2018 report ranked India among the top
10
Nikkei
1.9
408
22,420
'improvers' globally in ease of doing business.
Hang Seng
1.2
349
28,594
News Analysis
Shanghai Com
0.1
3
3,396
Result Review: Tech Mahindra
Detailed analysis on Pg2
Advances / Declines
BSE
NSE
Advances
1,522
964
Investor’s Ready Reckoner
Declines
1,292
794
Key Domestic & Global Indicators
Unchanged
161
65
Stock Watch: Latest investment recommendations on 150+ stocks
Refer Pg5 onwards
Volumes (` Cr)
Top Picks
BSE
5,318
CMP
Target
Upside
Company
Sector
Rating
NSE
37,910
(`)
(`)
(%)
Blue Star
Capital Goods Accumulate
763
867
13.6
Dewan Housing Finance
Financials
Accumulate
642
690
7.4
Net Inflows (` Cr)
Net
Mtd
Ytd
Asian Granito
Other
Accumulate
501
570
13.7
FII
56
1,978
38,507
Navkar Corporation
Other
Buy
189
265
40.0
MFs
446
9,067
95,411
KEI Industries
Capital Goods
Buy
330
380
15.3
More Top Picks on Pg4
Top Gainers
Price (`)
Chg (%)
Key Upcoming Events
Sci
103
11.8
Previous
Consensus
Date
Region
Event Description
Reading
Expectations
Mmtc
71
11.4
Nov02
Germany PMI Manufacturing
60.50
60.50
Religare
46
9.9
Nov02
US
Initial Jobless claims
233.00
235.00
Idfcbank
62
9.9
Nov02
Germany Unemployment change (000's)
(22.00)
(10.00)
Hindcopper
76
9.3
Nov02
US
Unnemployment rate
4.20
4.20
Nov03
UK
BOE Announces rates
0.25
0.50
More Events on Pg7
Top Losers
Price (`)
Chg (%)
Fsl
42
(4.4)
Eichermot
30,930
(4.2)
Ashokley
126
(3.4)
Infratel
427
(3.4)
Niittech
656
(3.2)
As on November, 01 2017
Market Outlook
November 02, 2017
News Analysis
Tech Mahindra (CMP: `481 / TP: `526 /Upside: 9.4%)
The company posted higher than expected on all fronts. In rupee terms, revenues
came in at `7,606cr V/s `7,582cr expectations, up 3.7% qoq. The growth was
mainly driven Europe and ROW; while USA dipped in growth. In terms of Industry;
Retail, Transport & Logistics was driving the growth; while the Communications,
Manufacturing and BFSI posted dip during the quarter. In terms of the Industry, all
the major Industry verticals apart from the Communications which was in decline
last quarter; other major industry verticals like BFSI and Manufacturing which grew
last quarter, posted a dip qoq.
On the operating front, the utilization levels during the quarter came in at 81% V/s
77% in 1QFY2018, which along with volume also aided the margins to come in
higher. On the operating front the EBITDA margin, came in at 14.5% V/s 14.0%
expected, and
12.7% in 1QFY2018; a qoq expansion of
50bps qoq.
Consequently, PAT came in at `836cr V/s `886cr expected, a growth of 4.7% qoq.
On the client additions front, the company added 21 clients; with major of the
client additions of US$1-5mn. Also, in terms of the growth drivers, the main driver
has been client additions during the quarter; with repeat business contributing 95%
V/s 97.2% in 1QFY2018.We maintain our accumulate rating on the stock.
Y/E
Sales OPM
PAT
EPS ROE P/E P/BV EV/EBITDA EV/Sales
March
(` cr)
(%)
(` cr)
(`)
(%)
(x)
(x)
(x)
(x)
FY2017E
30,545
15.0
3,062
35.2
16.8
13.7
2.3
9.9
1.5
FY2018E
32,988
15.0
3,272
37.6
16.2
12.8
2.1
9.1
1.4
Economic and Political News
Sept retail inflation for factory workers hits 2.89% from 4.14% a year ago
Investment in food processing to surpass `65,000cr: Badal
India's current account deficit to more than double to 1.5% of GDP in FY18
Corporate News
JSW Energy Q2 PAT up 37 per cent YoY at `297cr
Mahindra Holidays Q2 net dips 3.5% to `32cr
Godrej Consumer Q2 net up 12% at `362cr on volume growth
Market Outlook
November 02, 2017
Quarterly Bloomberg Brokers Consensus Estimate
Glenmark Pharma Ltd - Nov 02, 2017
Particulars ( ` cr)
2QFY18E
2QFY17
y-o-y (%)
1QFY18 q-o-q (%)
Sales
2,331
2,224
4.9
2,363
(1.4)
EBIDTA
327
448
(27.1)
577
(43.4)
%
14.1
20.2
24.5
PAT
191
223
(14.4)
333
(42.7)
PowerGrid Ltd - Nov 02, 2017
Particulars ( ` cr)
2QFY18E
2QFY17
y-o-y (%)
1QFY18 q-o-q (%)
Sales
7,376
6,254
17.9
7,181
2.8
EBIDTA
6,472
5,599
15.6
6,200
4.4
%
87.8
89.5
86.3
PAT
2,129
1,872
13.8
2,052
3.8
Market Outlook
November 02, 2017
Top Picks HHHHH
Market Cap
CMP
Target
Upside
Company
Rationale
(` Cr)
(`)
(`)
(%)
Strong growth in domestic business due to its leade`hip
in acute therapeutic segment. Alkem expects to launch
Alkem Laboratories
22,643
1,894
2,079
9.8
more products in USA, which bodes for its international
business.
We expect the company would report strong profitability
Asian Granito
1,508
501
570
13.7
owing to better product mix, higher B2C sales and
amalgamation synergy.
Favorable outlook for the AC industry to augur well for
Cooling products business which is out pacing the
Blue Star
7,310
763
867
13.6
market growth. EMPPAC division's profitability to
improve once operating environment turns around.
With a focus on the low and medium income (LMI)
consumer segment, the company has increased its
Dewan Housing Finance
20,138
642
690
7.4
presence in tier-II & III cities where the growth
opportunity is immense.
Loan growth is likely to pick up after a sluggish FY17.
Lower credit cost will help in strong bottom-line growth.
Karur Vysya Bank
7,835
130
180
38.8
Increasing share of CASA will help in NIM
improvement.
High order book execution in EPC segment, rising B2C
KEI Industries
2,563
330
380
15.3
sales and higher exports to boost the revenues and
profitability
Expected to benefit from the lower capex requirement
Music Broadcast
2,225
390
434
11.3
and 15 year long radio broadcast licensing.
Massive capacity expansion along with rail advantage
Navkar Corporation
2,699
189
265
40.0
at ICD as well CFS augur well for the company
Strong brands and distribution network would boost
Siyaram Silk Mills
2,781
593
650
9.6
growth going ahead. Stock currently trades at an
inexpensive valuation.
Market leadership in Hindi news genre and no.
2
viewership ranking in English news genre, exit from the
TV Today Network
2,109
354
435
23.1
radio business, and anticipated growth in ad spends by
corporate to benefit the stock.
After GST, the company is expected to see higher
volumes along with improving product mix. The Gujarat
Maruti Suzuki
2,48,764
8,235
8,658
5.1
plant will also enable higher operating leverage which
will be margin accretive.
We expect loan book to grow at 24.3% over next two
GIC Housing
2,595
482
655
35.9
year; change in borrowing mix will help in NIM
improvement..
Source: Company, Angel Research
Market Outlook
November 02, 2017
Key Upcoming Events
Result Calendar
D ate
C ompany
November 02, 2017
Areva, Ramco Cements, Andhra Bank, Sesa Goa, Glenmark Pharma., Power Grid Corpn, TCI
November 03, 2017
Punjab Natl.Bank, Power Fin.Corpn., Union Bank, UCO Bank, Hindalco, Tata Power Co., VRL Logistics
Source: Bloomberg, Angel Research
Global economic events release calendar
Bl oomberg Data
D ate
Time
C ountry
Event Description
Unit
Period
L ast Reporte d
E stimate d
Nov 02, 2017
2:25 PMGermany PMI Manufacturing
Value
Oct F
60.50
60.50
6:00 PMUS
Initial Jobless claims
Thousands
Oct 28
233.00
235.00
2:25 PMGermany Unempl oyment change (000's)
Thousands
Oct
(22.00)
(10.00)
6:00 PMUS
Unnemployment rate
%
Oct
4.20
4.20
Nov 03, 2017
5:30 PMUK
BOE Announce s rate s
% Ratio
Nov 2
0.25
0.50
6:00 PMUS
Change in N onfarm payrolls
Thousands
Oct
(33.00)
310.00
Nov 06, 2017
2:25 PMGermany PMI Services
Value
Oct F
55.20
Nov 08, 2017
China
Exports YoY%
% Change
Oct
8.10
7.00
Nov 09, 2017
7:00 AMChina
Consumer Price Index (YoY)
% Change
Oct
1.60
1.70
3:00 PMUK
Industrial Production (YoY)
% Change
Sep
1.60
Nov 10, 2017
India
Imports YoY%
% Change
Oct
18.09
India
Exports YoY%
% Change
Oct
25.67
5:30 PMIndia
Industrial Production YoY
% Change
Sep
4.30
Nov 14, 2017
3:30 PMEuro Zone Euro-Zone GDP s.a. (QoQ)
% Change
3Q P
0.60
7:30 AMChina
Industrial Production (YoY)
% Change
Oct
6.60
6.30
Source: Bloomberg, Angel Research
Market Outlook
November 02, 2017
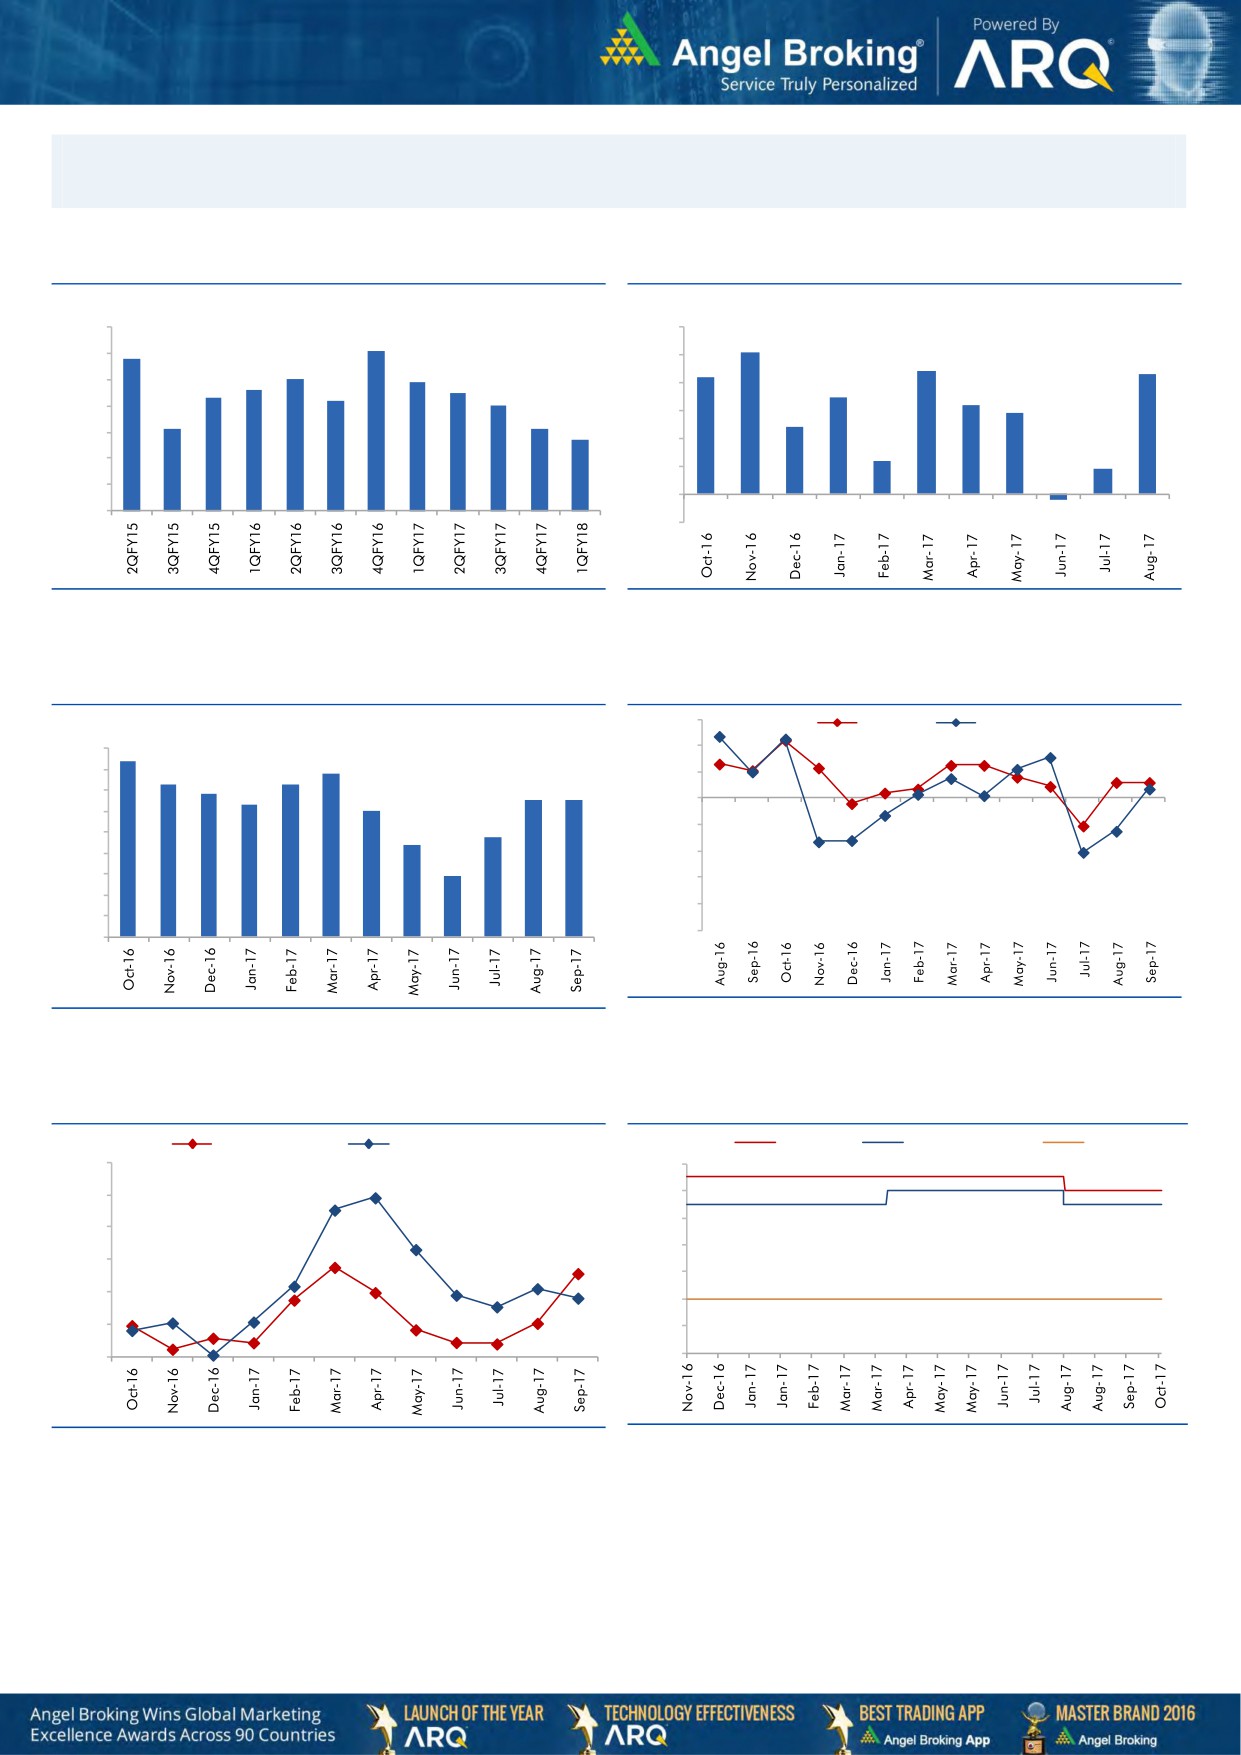
Macro watch
Exhibit 1: Quarterly GDP trends
Exhibit 2: IIP trends
(%)
(%)
10.0
6.0
9.1
5.1
8.8
9.0
5.0
4.4
4.3
8.0
7.9
4.2
7.6
7.5
8.0
7.3
7.2
4.0
3.5
7.0
3.2
2.9
7.0
6.1
6.1
3.0
2.4
5.7
6.0
2.0
1.2
0.9
5.0
1.0
4.0
-
3.0
(1.0)
(0.2)
Source: CSO, Angel Research
Source: MOSPI, Angel Research
Exhibit 3: Monthly CPI inflation trends
Exhibit 4: Manufacturing and services PMI
56.0
Mfg. PMI
Services PMI
(%)
4.5
4.2
54.0
3.9
4.0
3.6
3.7
52.0
3.4
3.3
3.3
3.5
3.2
3.0
50.0
3.0
2.2
2.4
48.0
2.5
2.0
46.0
1.5
1.5
44.0
1.0
42.0
0.5
40.0
-
Source: Market, Angel Research; Note: Level above 50 indicates expansion
Source: MOSPI, Angel Research
Exhibit 5: Exports and imports growth trends
Exhibit 6: Key policy rates
(%)
Exports yoy growth
Imports yoy growth
(%)
Repo rate
Reverse Repo rate
CRR
60.0
6.50
50.0
6.00
5.50
40.0
5.00
30.0
4.50
20.0
4.00
10.0
3.50
0.0
3.00
Source: Bloomberg, Angel Research
Source: RBI, Angel Research
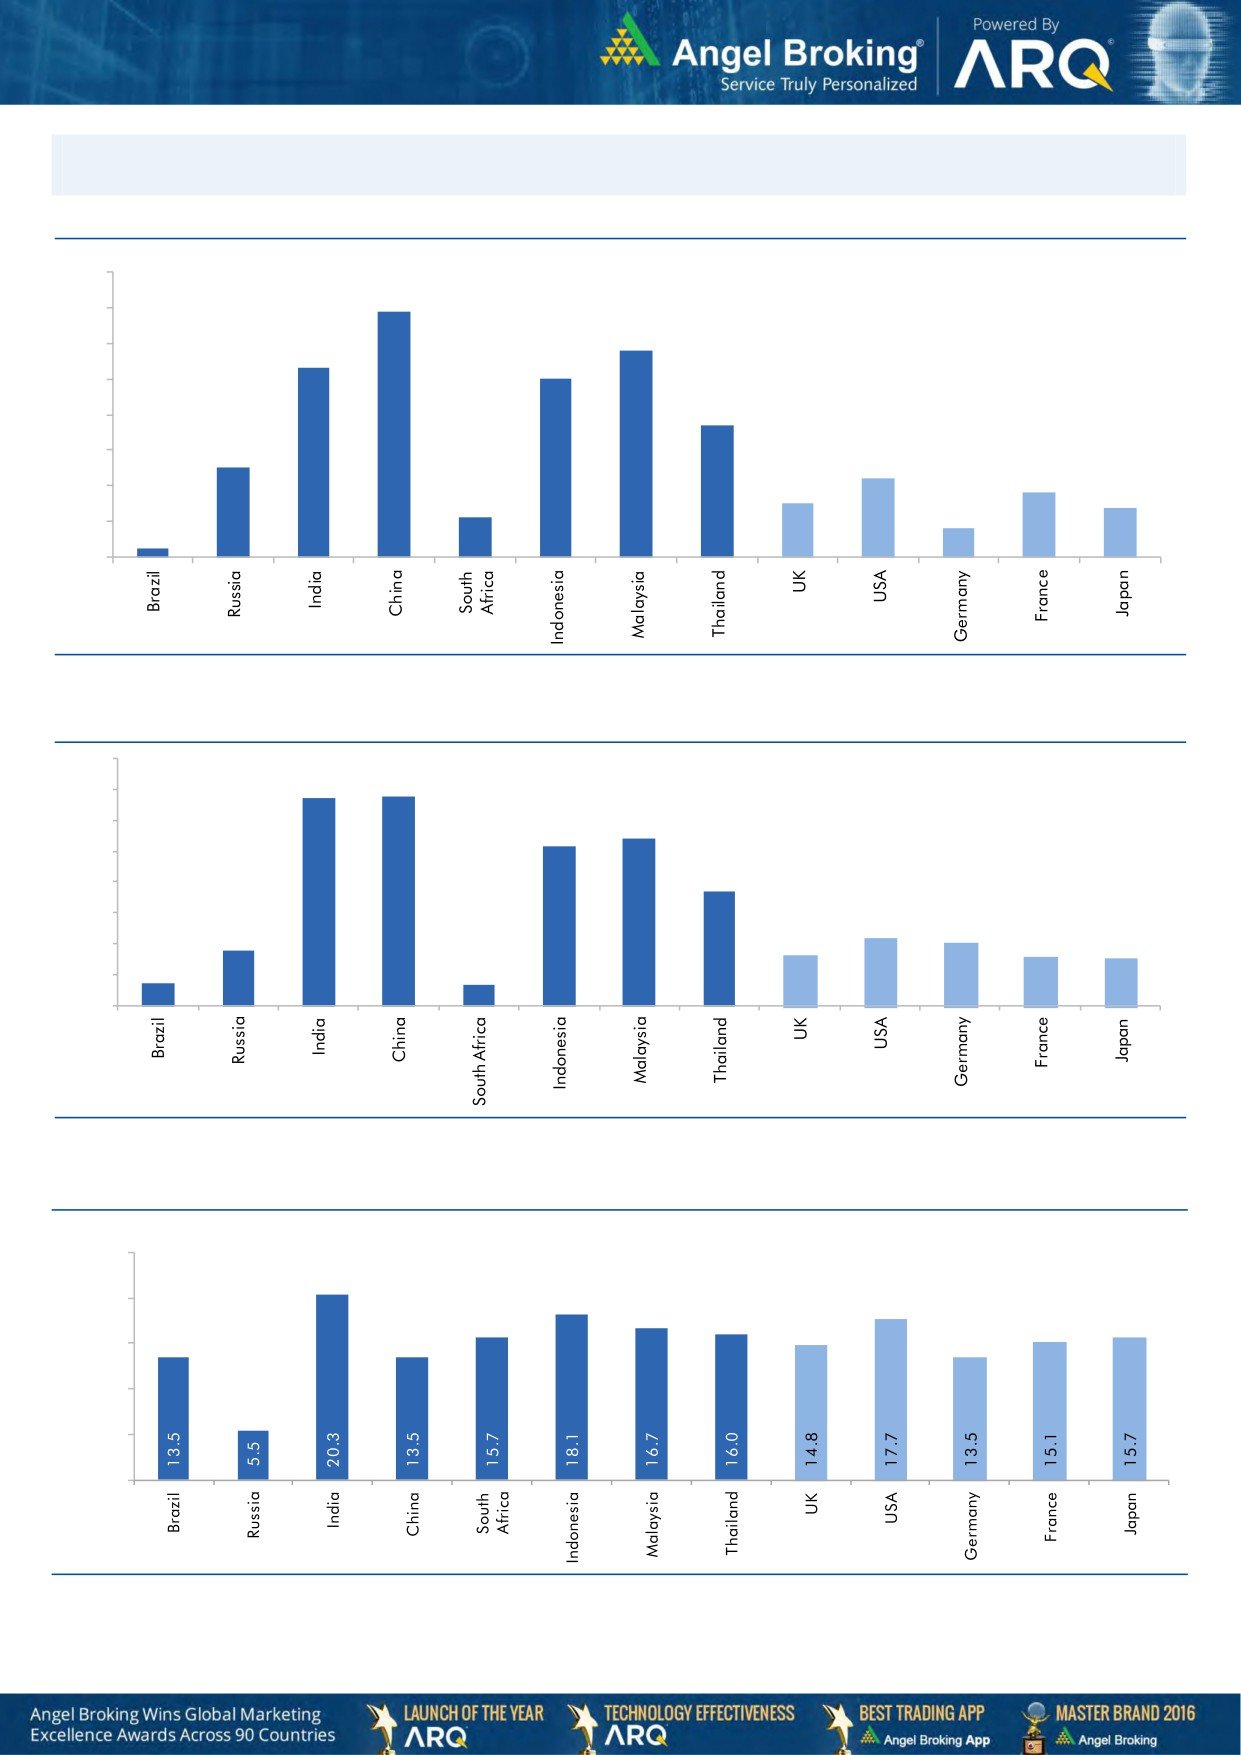
Market Outlook
November 02, 2017
Global watch
Exhibit 1: Latest quarterly GDP Growth (%, yoy) across select developing and developed countries
(%)
8.0
6.9
7.0
5.8
6.0
5.3
5.0
5.0
1.1
3.7
4.0
2.5
3.0
2.2
1.8
2.0
1.5
1.4
0.8
1.0
0.3
-
Source: Bloomberg, Angel Research
Exhibit 2: 2017 GDP Growth projection by IMF (%, yoy) across select developing and developed countries
(%)
6.7
6.8
7.0
6.0
5.4
5.2
5.0
3.7
4.0
3.0
1.8
2.2
2.0
1.7
1.6
2.0
0.7
1.5
0.7
1.0
-
Source: IMF, Angel Research
Exhibit 3: One year forward P-E ratio across select developing and developed countries
(x)
25.0
20.0
15.0
10.0
5.0
-
Source: IMF, Angel Research
Market Outlook
November 02, 2017
Exhibit 4: Relative performance of indices across globe
Returns (%)
Country
Name of index
Closing price
1M
3M
1YR
Brazil
Bovespa
73,824
(0.6)
11.0
14.8
Russia
Micex
2,083
0.3
6.0
6.1
India
Nifty
10,441
6.9
4.3
20.9
China
Shanghai Composite
3,396
1.2
4.0
8.0
South Africa
Top 40
53,057
6.9
8.2
19.7
Mexico
Mexbol
48,334
(4.3)
(5.8)
3.5
Indonesia
LQ45
1,000
1.7
4.2
7.5
Malaysia
KLCI
1,744
(0.7)
(1.5)
3.9
Thailand
SET 50
1,089
1.7
8.1
15.0
USA
Dow Jones
23,435
3.9
6.4
30.5
UK
FTSE
7,488
0.7
1.0
10.3
Japan
Nikkei
22,420
10.1
12.5
28.9
Germany
DAX
13,466
6.0
9.9
31.3
France
CAC
5,514
3.1
7.5
21.4
Source: Bloomberg, Angel Research p68in4
Stock Watch
November 02, 2017
Company Name
Reco
CMP
Target
Mkt Cap
Sales ( Čcr )
OPM(%)
EPS (Č)
PER(x)
P/BV(x)
RoE(%)
EV/Sales(x)
(Č)
Price ( Č)
( Č cr )
FY18E FY19E
FY18E
FY19E
FY18E
FY19E
FY18E
FY19E
FY18E
FY19E
FY18E
FY19E
FY18E
FY19E
Agri / Agri Chemical
Rallis
Reduce
243
209
4,727
1,873
2,099
15.0
15.0
9.5
10.5
25.6
23.2
3.9
3.5
15.8
16.0
2.4
2.2
United Phosphorus
Neutral
781
-
39,701
18,922
21,949
18.0
18.5
36.2
45.6
21.6
17.1
4.5
3.7
22.7
23.8
2.3
1.9
Auto & Auto Ancillary
Ashok Leyland
Neutral
126
-
37,006
23,339
27,240
10.1
10.8
4.7
6.2
27.2
20.3
5.4
4.8
20.0
23.6
1.5
1.3
Bajaj Auto
Neutral
3,241
-
93,769
23,936
27,955
19.5
20.1
142.7
167.3
22.7
19.4
4.9
4.4
21.8
22.8
3.5
2.9
Bharat Forge
Buy
704
875
32,756
7,637
8,755
21.7
23.2
36.1
47.3
19.5
14.9
3.5
3.0
18.5
20.8
4.1
3.5
Eicher Motors
Neutral
30,930
-
84,199
19,043
22,837
19.5
19.9
835.4
1,019.0
37.0
30.4
13.8
10.7
40.9
37.8
4.3
3.5
Gabriel India
Neutral
197
-
2,835
1,782
2,033
9.7
10.2
7.1
8.9
27.8
22.3
5.6
4.7
21.0
22.2
1.5
1.3
Hero Motocorp
Accumulate
3,816
4,129
76,213
32,239
36,878
16.0
15.6
184.4
206.5
20.7
18.5
6.5
5.7
31.3
30.7
2.1
1.8
Jamna Auto Industries Neutral
65
-
2,598
1,441
1,662
14.4
14.8
13.9
17.6
4.7
3.7
1.3
1.0
30.0
31.0
1.8
1.5
Mahindra and Mahindra Neutral
1,350
-
83,854
46,971
53,816
13.6
14.0
67.7
79.8
19.9
16.9
2.9
2.5
15.0
15.9
1.7
1.4
Maruti
Accumulate
8,235
8,658
248,764
81,825
101,245
15.0
15.0
283.5
356.0
29.1
23.1
6.4
5.2
21.9
22.4
2.7
2.1
Minda Industries
Neutral
887
-
7,661
4,328
5,084
11.0
11.9
27.3
36.4
32.5
24.4
6.9
5.4
23.1
25.6
1.9
1.6
Motherson Sumi
Neutral
368
-
77,565
55,937
64,445
10.8
11.4
16.9
21.1
21.8
17.5
4.9
5.0
25.2
25.4
1.4
1.2
Tata Motors
Neutral
437
-
126,105
303,167
343,649
11.8
13.8
33.1
54.7
13.2
8.0
2.2
1.7
16.9
23.0
0.5
0.4
TVS Motor
Neutral
709
-
33,684
13,992
16,216
9.0
9.4
17.1
20.3
41.6
34.9
11.0
8.5
29.7
27.7
2.3
2.0
Amara Raja Batteries
Buy
700
858
11,965
6,140
7,122
14.3
15.6
29.3
39.0
23.9
18.0
4.1
3.4
17.1
19.0
2.0
1.7
Exide Industries
Neutral
212
-
17,982
8,689
9,854
15.1
15.2
9.7
11.0
21.9
19.2
3.9
3.4
15.7
16.1
1.8
1.6
Apollo Tyres
Neutral
245
-
12,453
15,739
17,326
13.3
14.6
20.4
26.7
12.0
9.2
1.5
1.3
20.4
26.7
1.0
0.9
Ceat
Neutral
1,683
-
6,810
6,661
7,717
11.1
14.2
116.2
178.2
14.5
9.5
2.5
2.1
15.2
21.3
1.1
1.0
JK Tyres
Neutral
147
-
3,332
8,318
9,239
16.2
16.4
21.0
27.5
7.0
5.3
1.4
1.1
19.1
20.4
0.8
0.7
Swaraj Engines
Neutral
2,030
-
2,522
788
889
16.4
16.5
71.6
81.0
28.4
25.1
8.2
7.6
29.6
31.0
2.9
2.5
Subros
Neutral
267
-
1,603
1,855
2,135
11.6
11.8
10.3
14.7
26.1
18.2
4.0
3.4
15.8
19.1
1.1
0.9
Capital Goods
BEML
Neutral
1,721
-
7,166
4,286
5,194
7.1
8.2
42.9
58.1
40.1
29.6
3.3
3.0
7.6
8.7
1.7
1.4
Bharat Electronics
Neutral
186
-
45,651
10,258
12,470
19.6
19.5
7.3
8.6
25.5
21.6
0.5
0.4
20.4
21.9
3.9
3.2
Voltas
Neutral
562
-
18,587
6,778
8,004
9.6
11.0
17.1
22.4
32.9
25.1
7.8
6.9
17.7
19.8
2.4
2.1
BHEL
Neutral
99
-
36,310
33,200
39,167
6.8
9.5
6.2
11.2
16.0
8.8
0.7
0.7
4.6
8.0
0.7
0.5
Blue Star
Accumulate
763
867
7,310
5,220
6,207
6.3
6.6
16.8
22.3
45.4
34.3
9.0
8.0
19.9
23.3
1.4
1.1
CG Power and Industrial
Neutral
87
-
5,428
6,555
7,292
7.5
7.5
-
0.8
8,660.0
108.3
1.3
1.4
0.1
1.2
0.9
0.8
Solutions
Greaves Cotton
Neutral
129
-
3,150
1,778
1,993
14.7
15.1
8.1
9.1
15.9
14.2
3.6
3.3
21.8
23.6
1.5
1.4
Stock Watch
November 02, 2017
Company Name
Reco
CMP
Target
Mkt Cap
Sales ( Čcr )
OPM(%)
EPS (Č)
PER(x)
P/BV(x)
RoE(%)
EV/Sales(x)
(Č)
Price ( Č)
( Č cr )
FY18E FY19E
FY18E
FY19E
FY18E
FY19E
FY18E
FY19E
FY18E
FY19E
FY18E
FY19E
FY18E
FY19E
Capital Goods
KEC International
Buy
304
350
7,804
9,779
11,113
9.4
9.8
14.2
18.2
21.4
16.7
4.1
3.4
21.1
22.1
1.1
0.9
KEI Industries
Buy
330
380
2,563
3,001
3,391
10.0
10.0
13.0
16.1
25.3
20.5
4.6
3.8
18.2
18.7
1.0
0.9
Thermax
Neutral
995
-
11,857
4,125
4,747
10.3
10.8
26.7
31.5
37.3
31.6
4.2
3.8
11.2
12.0
2.6
2.3
VATech Wabag
Buy
587
681
3,203
3,867
4,126
9.6
10.0
34.9
39.8
16.8
14.7
2.8
2.4
17.7
17.5
0.8
0.8
Cement
ACC
Neutral
1,817
-
34,129
12,255
13,350
13.5
14.3
58.0
66.2
31.3
27.5
3.7
3.5
11.5
12.2
2.8
2.5
Ambuja Cements
Neutral
283
-
56,144
10,250
11,450
17.5
19.0
7.2
8.3
39.3
34.1
2.8
2.7
7.0
7.8
5.3
4.6
India Cements
Neutral
193
-
5,960
6,135
6,750
14.8
15.2
8.5
11.5
22.8
16.8
1.1
1.1
4.8
6.2
1.3
1.2
JK Cement
Neutral
1,005
-
7,022
4,150
4,775
19.2
20.0
49.0
63.5
20.5
15.8
3.2
2.8
17.0
18.5
2.1
1.8
J K Lakshmi Cement
Neutral
434
-
5,107
3,422
3,757
15.5
17.0
13.5
23.2
32.2
18.7
3.3
2.9
10.8
15.5
1.9
1.7
Orient Cement
Neutral
172
-
3,529
2,215
3,233
16.8
17.0
5.9
6.9
29.2
25.0
2.2
2.1
10.8
10.1
2.6
1.7
UltraTech Cement
Neutral
4,421
-
121,363
28,250
35,150
20.2
23.5
77.5
122.2
57.0
36.2
4.8
4.4
9.6
14.8
4.8
3.8
Construction
KNR Constructions
Neutral
256
-
3,606
1,846
2,203
14.5
14.5
12.1
13.7
21.2
18.8
1.2
1.0
17.5
16.7
2.0
1.7
Larsen & Toubro
Neutral
1,215
-
170,229
95,787
109,476
10.2
11.6
44.5
50.8
27.3
24.0
3.4
3.1
12.9
13.1
2.3
2.1
Gujarat Pipavav Port
Neutral
142
-
6,860
739
842
61.6
62.7
5.1
6.2
27.8
23.1
3.5
3.4
12.7
14.9
8.7
7.6
PNC Infratech
Neutral
196
-
5,019
2,040
2,935
13.0
13.0
6.4
9.0
30.6
21.7
0.8
0.7
9.7
12.2
2.5
1.8
Simplex Infra
Neutral
530
-
2,623
6,012
6,619
11.6
11.7
21.1
31.0
25.2
17.1
1.8
1.6
6.5
8.6
1.0
0.9
Sadbhav Engineering
Neutral
316
-
5,422
3,823
4,426
10.7
10.8
10.3
11.8
30.7
26.8
3.7
3.2
10.1
10.5
1.7
1.5
NBCC
Neutral
263
-
23,657
9,099
12,706
6.4
6.4
7.3
9.6
36.1
27.5
1.6
1.3
27.5
30.5
2.5
1.8
MEP Infra
Neutral
99
-
1,605
2,403
2,910
18.3
16.8
2.4
6.1
42.0
16.3
15.9
10.7
35.2
55.8
1.8
1.5
SIPL
Neutral
118
-
4,172
2,060
2,390
46.8
47.7
(5.8)
(3.1)
4.4
5.1
(14.2)
(2.3)
6.8
6.3
Engineers India
Neutral
184
-
12,382
1,795
2,611
21.1
22.4
5.9
8.1
31.1
22.7
2.2
2.2
12.9
16.1
5.3
3.5
Financials
Axis Bank
Accumulate
534
580
127,972
32,558
35,843
3.5
3.2
27.8
41.0
19.2
13.0
2.1
1.8
11.4
14.9
-
-
Bank of Baroda
Neutral
172
-
39,712
22,533
26,079
2.4
2.4
12.0
20.9
14.4
8.3
0.9
0.9
6.6
11.0
-
-
Canara Bank
Neutral
411
-
24,576
17,925
20,235
2.0
2.1
18.5
36.5
22.2
11.3
0.8
0.8
3.4
6.2
-
-
Can Fin Homes
Buy
471
2,128
6,268
586
741
3.5
3.5
107.8
141.0
4.4
3.3
1.0
0.8
24.1
25.6
-
-
Cholamandalam Inv. &
Neutral
1,225
-
19,145
2,826
3,307
6.3
6.3
53.7
64.6
22.8
19.0
3.9
3.3
18.3
18.9
-
-
Fin. Co.
Dewan Housing Finance Accumulate
642
690
20,138
2,676
3,383
2.4
2.7
37.4
49.7
17.2
12.9
2.3
2.0
13.8
16.2
-
-
Equitas Holdings
Buy
146
235
4,948
1,125
1,380
9.6
9.8
1.5
6.0
97.4
24.3
2.2
2.1
2.4
8.2
-
-
Federal Bank
Neutral
121
-
23,513
4,896
5,930
2.8
3.1
5.4
7.6
22.5
15.9
1.9
1.8
8.5
11.0
-
-
Stock Watch
November 02, 2017
Company Name
Reco
CMP
Target
Mkt Cap
Sales ( Čcr )
OPM(%)
EPS (Č)
PER(x)
P/BV(x)
RoE(%)
EV/Sales(x)
(Č)
Price ( Č)
( Č cr )
FY18E FY19E
FY18E
FY19E
FY18E
FY19E
FY18E
FY19E
FY18E
FY19E
FY18E
FY19E
FY18E
FY19E
Financials
GIC Housing
Buy
482
655
2,595
376
477
3.6
3.7
33.0
40.0
14.6
12.1
2.6
2.2
20.0
23.0
-
-
HDFC Bank
Neutral
1,820
-
470,391
55,236
63,253
4.5
4.4
68.9
82.4
26.4
22.1
4.6
3.8
18.7
18.5
-
-
ICICI Bank
Neutral
313
-
200,954
42,361
51,378
3.6
3.9
18.4
25.7
17.0
12.2
1.9
1.8
11.3
15.0
-
-
Karur Vysya Bank
Buy
130
180
7,835
3,289
3,630
3.7
3.9
10.8
14.1
12.0
9.2
1.4
1.3
12.5
14.7
-
-
LIC Housing Finance
Accumulate
599
630
30,204
4,895
6,332
3.4
3.7
50.7
66.8
11.8
9.0
2.4
1.9
21.7
23.8
-
-
Punjab Natl.Bank
Neutral
199
-
42,325
23,708
25,758
2.1
2.1
5.9
16.4
33.8
12.1
1.0
1.0
3.0
8.3
-
-
RBL Bank
Neutral
525
-
21,681
2,309
2,888
2.6
2.5
16.4
19.1
32.1
27.5
4.0
3.6
13.3
13.8
-
-
Repco Home Finance
Buy
619
825
3,871
496
597
4.4
4.2
38.5
48.7
16.1
12.7
2.9
2.4
19.6
20.6
-
-
South Ind.Bank
Neutral
31
-
5,557
3,195
3,567
3.0
3.1
3.0
3.8
10.2
8.0
1.0
0.9
10.5
11.9
-
-
St Bk of India
Neutral
320
-
276,053
105,827
121,056
2.4
2.5
16.1
25.6
19.9
12.5
1.6
1.4
6.6
9.9
-
-
Union Bank
Neutral
179
-
13,018
14,650
16,225
2.3
2.3
23.1
32.5
7.8
5.5
0.6
0.5
7.1
9.2
-
-
Yes Bank
Neutral
318
-
72,815
11,088
13,138
3.0
2.9
84.0
99.3
3.8
3.2
0.6
0.5
16.3
16.8
-
-
FMCG
Akzo Nobel India
Neutral
1,905
-
9,136
3,164
3,607
13.8
13.7
58.6
67.9
32.5
28.0
8.0
7.0
24.5
25.1
2.7
2.4
Asian Paints
Neutral
1,175
-
112,677
17,603
20,615
18.6
18.6
2,128.9
2,543.3
0.6
0.5
11.6
9.8
28.0
28.9
6.2
5.2
Britannia
Neutral
4,695
-
56,364
9,690
11,278
14.8
15.4
84.0
101.0
55.9
46.5
20.4
16.2
40.6
39.0
5.8
5.0
Colgate
Neutral
1,043
-
28,361
4,420
5,074
24.9
25.3
28.6
32.8
36.5
31.8
14.4
11.6
43.8
40.5
6.2
5.3
Dabur India
Neutral
348
-
61,319
8,346
9,344
19.6
19.9
7.8
9.0
44.6
38.7
9.0
8.1
25.2
24.8
7.0
6.1
GlaxoSmith Con*
Neutral
5,282
-
22,212
5,072
5,760
18.2
18.4
176.3
199.2
30.0
26.5
6.4
5.8
21.2
21.7
3.7
3.2
Godrej Consumer
Neutral
967
-
65,885
10,171
11,682
20.8
21.5
21.7
27.1
44.6
35.7
10.0
8.6
22.3
23.4
6.6
5.7
HUL
Neutral
1,260
-
272,648
37,077
41,508
20.3
21.8
5,189.9
6,318.5
0.2
0.2
38.4
32.8
74.8
82.0
7.2
6.4
ITC
Neutral
270
-
328,503
44,588
49,853
37.0
37.3
9.6
11.0
28.1
24.5
6.9
6.6
25.1
27.3
6.9
6.1
Marico
Neutral
316
-
40,766
6,788
7,766
18.5
19.2
7.1
8.5
44.5
37.2
15.6
13.3
36.9
38.0
5.8
5.1
Nestle*
Neutral
7,310
-
70,484
10,083
11,182
20.0
20.9
119.7
141.3
61.1
51.7
215.2
196.7
36.7
39.8
6.7
6.0
Tata Global
Neutral
228
-
14,377
7,121
7,641
11.9
12.3
6.9
8.0
33.0
28.5
2.2
2.1
6.8
7.2
1.8
1.7
Procter & Gamble
Neutral
8,699
-
28,238
3,034
3,579
27.1
27.7
167.7
198.8
51.9
43.8
13.9
12.0
28.8
29.5
8.7
7.3
Hygiene
IT
HCL Tech^
Buy
838
1,014
119,603
50,009
54,608
22.1
22.1
62.8
67.6
13.4
12.4
3.0
2.6
22.4
20.6
2.1
1.8
Infosys
Buy
926
1,120
212,759
70,333
75,960
26.0
26.0
61.7
65.9
15.0
14.1
2.8
2.6
18.9
18.7
2.4
2.2
TCS
Neutral
2,603
-
512,804
123,384
134,488
26.1
26.1
133.2
143.7
19.5
18.1
5.4
5.0
27.6
27.8
3.8
3.4
Tech Mahindra
Accumulate
489
533
47,716
31,015
33,496
15.0
15.0
35.6
38.1
13.7
12.8
2.3
2.2
17.0
16.3
1.3
1.1
Stock Watch
November 02, 2017
Company Name
Reco
CMP
Target
Mkt Cap
Sales ( Čcr )
OPM(%)
EPS (Č)
PER(x)
P/BV(x)
RoE(%)
EV/Sales(x)
(Č)
Price ( Č)
( Č cr )
FY18E FY19E
FY18E
FY19E
FY18E
FY19E
FY18E
FY19E
FY18E
FY19E
FY18E
FY19E
FY18E
FY19E
IT
Wipro
Neutral
293
-
142,643
54,164
56,544
22.3
22.3
18.8
19.5
15.6
15.0
2.5
2.2
15.0
13.6
1.9
1.6
Media
D B Corp
Neutral
360
-
6,623
2,404
2,625
30.5
31.5
23.7
26.9
15.2
13.4
3.6
3.1
23.5
22.8
2.6
2.4
HT Media
Neutral
102
-
2,368
2,589
2,830
15.1
15.4
8.3
10.9
12.3
9.3
1.0
0.9
8.4
10.4
0.5
0.3
Jagran Prakashan
Buy
175
225
5,727
2,541
2,835
28.5
28.7
12.7
14.1
13.8
12.4
2.9
2.5
21.3
21.4
2.1
1.8
Sun TV Network
Neutral
855
-
33,694
3,238
3,789
51.9
55.1
30.9
38.0
27.7
22.5
7.9
6.9
30.0
31.0
9.9
8.4
Hindustan Media
Neutral
231
-
1,693
1,002
1,074
23.3
23.5
29.2
33.8
7.9
6.8
1.2
1.1
15.6
15.4
0.7
0.4
Ventures
TV Today Network
Buy
354
435
2,109
667
727
27.7
27.7
18.6
20.1
19.0
17.6
3.0
3.0
15.6
17.3
2.7
2.5
Music Broadcast Limited Accumulate
390
434
2,225
271
317
91.0
109.0
6.0
10.0
65.0
39.0
4.1
3.7
6.5
9.3
7.8
6.4
Metals & Mining
Coal India
Neutral
286
-
177,346
82,301
91,235
17.0
18.0
17.1
20.5
16.7
13.9
3.1
3.0
45.0
55.0
1.8
1.6
Hind. Zinc
Neutral
325
-
137,154
22,108
24,555
57.0
58.0
22.1
26.3
14.7
12.3
4.8
3.9
32.0
35.0
5.2
4.4
Hindalco
Neutral
275
-
61,778
102,350
105,355
13.5
14.5
21.5
24.5
12.8
11.2
1.8
1.5
15.0
15.2
1.2
1.1
JSW Steel
Neutral
265
-
64,044
64,500
68,245
21.1
21.5
20.1
21.2
13.2
12.5
2.4
2.1
-
-
1.7
1.6
NMDC
Neutral
129
-
40,656
10,209
11,450
47.0
48.0
11.1
12.1
11.6
10.6
1.6
1.5
-
-
3.5
3.2
SAIL
Neutral
81
-
33,640
54,100
63,555
3.0
10.0
(10.0)
1.5
54.3
1.1
1.1
-
-
1.6
1.4
Vedanta
Neutral
343
-
127,630
81,206
87,345
28.0
29.0
26.5
33.5
13.0
10.3
3.0
2.5
-
-
2.3
2.0
Tata Steel
Neutral
707
-
68,670
121,445
126,500
16.2
17.2
65.4
81.3
10.8
8.7
1.7
1.5
-
-
1.1
1.0
Oil & Gas
GAIL
Neutral
468
-
79,170
53,115
52,344
14.2
15.3
30.0
31.1
15.6
15.1
2.0
1.8
-
-
1.2
1.2
ONGC
Neutral
191
-
244,987
83,111
84,934
44.2
44.9
16.4
16.9
11.6
11.3
1.4
1.3
-
-
2.8
2.8
Indian Oil Corp
Neutral
416
-
202,006
396,116
432,560
8.5
8.8
40.1
42.2
10.4
9.9
1.8
1.6
-
-
0.7
0.6
Reliance Industries
Neutral
952
-
619,357
257,711
267,438
17.0
18.2
89.1
89.5
10.7
10.6
1.0
0.9
-
-
2.1
2.0
Pharmaceuticals
Alembic Pharma
Buy
504
600
9,494
3,903
4,584
18.2
19.2
21.8
27.2
23.1
18.5
4.2
3.5
19.8
20.6
2.5
2.1
Alkem Laboratories Ltd
Accumulate
1,894
2,079
22,643
6,320
7,341
17.5
19.8
72.7
96.6
26.1
19.6
4.6
3.9
16.7
18.7
3.5
3.0
Aurobindo Pharma
Accumulate
762
823
44,638
17,086
19,478
22.1
22.0
44.7
51.4
17.0
14.8
3.8
3.0
24.7
22.7
2.7
2.4
Aventis*
Neutral
4,458
-
10,268
2,508
2,862
16.8
16.8
139.9
153.8
31.9
29.0
4.6
3.8
23.5
25.8
3.7
3.1
Cadila Healthcare
Reduce
498
426
50,952
11,584
13,228
20.3
20.4
18.7
21.3
26.6
23.4
5.9
4.9
24.6
22.9
4.2
3.6
Cipla
Sell
624
458
50,212
16,619
19,437
15.4
16.2
19.7
24.3
31.7
25.7
3.6
3.2
12.0
13.2
3.2
2.7
Dr Reddy's
Neutral
2,361
-
39,142
15,844
17,973
17.6
18.2
91.7
111.0
25.8
21.3
2.9
2.6
11.9
13.0
2.7
2.4
GSK Pharma*
Neutral
2,627
-
22,249
3,260
3,651
15.0
18.0
46.1
58.6
57.0
44.8
11.7
12.1
20.0
26.5
6.7
6.1
Indoco Remedies
Sell
255
153
2,352
1,154
1,310
14.9
14.9
11.3
12.7
22.6
20.1
3.2
2.8
15.0
15.0
2.2
1.8
Stock Watch
November 02, 2017
Company Name
Reco
CMP
Target
Mkt Cap
Sales ( Čcr )
OPM(%)
EPS (Č)
PER(x)
P/BV(x)
RoE(%)
EV/Sales(x)
(Č)
Price ( Č)
( Č cr )
FY18E FY19E
FY18E
FY19E
FY18E
FY19E
FY18E
FY19E
FY18E
FY19E
FY18E
FY19E
FY18E
FY19E
Pharmaceuticals
Ipca labs
Neutral
526
-
6,631
3,593
4,022
14.5
15.5
19.4
25.2
27.1
20.9
2.5
2.2
9.5
11.2
1.9
1.7
Lupin
Buy
1,027
1,467
46,420
18,657
21,289
21.3
23.3
52.8
66.7
19.5
15.4
2.9
2.5
16.3
17.5
2.5
2.1
Natco Pharma
Accumulate
971
1,057
16,924
1,886
2,016
32.3
29.5
23.2
22.0
42.0
44.1
8.8
7.8
20.9
17.6
8.8
8.2
Sun Pharma
Neutral
548
-
131,587
32,899
36,451
26.9
25.4
31.6
32.3
17.4
17.0
3.1
2.7
18.7
18.8
3.6
3.1
Syngene International
Accumulate
505
557
10,107
1,402
1,823
32.8
36.0
15.9
20.7
31.8
24.5
5.9
4.9
18.7
20.0
7.2
5.5
Power
Tata Power
Neutral
85
-
23,045
32,547
33,806
20.5
20.5
4.7
5.4
18.1
15.9
1.7
1.5
10.5
10.5
1.7
1.6
NTPC
Neutral
180
-
148,542
86,070
101,246
28.3
30.7
12.9
16.2
14.0
11.1
1.4
1.3
10.6
12.4
3.1
2.8
Power Grid
Accumulate
211
223
110,125
29,183
32,946
89.7
90.0
18.0
20.8
11.7
10.1
2.0
1.7
17.7
18.2
7.7
7.2
Real Estate
Prestige Estate
Neutral
300
-
11,252
4,607
5,146
21.0
22.2
7.9
9.8
38.0
30.6
2.3
2.2
10.3
12.0
3.6
3.3
MLIFE
Buy
437
522
2,243
487
590
12.3
17.8
21.0
31.2
20.8
14.0
1.1
1.0
5.2
7.4
3.3
2.7
Telecom
Bharti Airtel
Neutral
538
-
215,220
97,903
105,233
36.0
36.3
9.3
11.1
57.9
48.7
2.8
2.6
5.0
5.6
3.2
2.9
Idea Cellular
Neutral
99
-
35,708
35,012
37,689
27.1
27.7
(4.4)
(2.7)
1.5
1.6
(6.8)
(4.6)
2.3
2.1
zOthers
Abbott India
Neutral
4,336
-
9,214
3,244
3,723
14.9
16.1
167.5
209.4
25.9
20.7
5.7
4.8
23.7
24.8
2.5
2.1
Asian Granito
Accumulate
501
570
1,508
1,169
1,286
12.5
12.5
16.0
19.7
31.4
25.4
3.4
3.0
10.7
11.6
1.5
1.4
Bajaj Electricals
Neutral
386
-
3,916
4,646
5,301
6.7
7.6
16.1
22.3
24.0
17.3
3.9
3.3
16.4
19.2
0.8
0.7
Banco Products (India)
Neutral
220
-
1,571
1,530
1,695
13.2
12.7
19.0
20.0
11.6
11.0
1.9
1.6
0.2
0.2
0.9
104.1
Coffee Day Enterprises
Neutral
221
-
4,547
3,494
3,913
17.4
18.0
4.8
5.7
-
38.7
2.0
1.9
-
0.1
1.8
1.5
Ltd
Elecon Engineering
Neutral
74
-
835
171
201
15.0
16.2
36.0
43.0
2.1
1.7
0.2
0.2
0.1
0.1
4.3
3.6
Garware Wall Ropes
Neutral
918
-
2,010
928
1,003
15.2
15.2
39.4
43.2
23.3
21.3
3.8
3.3
16.5
15.4
2.0
1.8
Goodyear India*
Neutral
810
-
1,869
1,717
1,866
11.8
12.3
47.9
49.8
16.9
16.3
2.6
2.3
15.6
15.7
0.8
112.2
Hitachi
Neutral
2,326
-
6,324
2,355
2,715
10.3
10.8
49.0
60.9
47.5
38.2
11.1
8.8
0.2
0.2
2.7
2.3
HSIL
Neutral
426
-
3,077
2,240
2,670
14.6
15.0
17.0
22.0
25.0
19.4
2.1
2.0
0.1
0.1
1.6
1.3
Interglobe Aviation
Neutral
1,246
-
45,082
22,570
27,955
14.2
15.0
63.6
81.8
19.6
15.3
10.3
8.7
0.5
0.6
1.7
1.3
Jyothy Laboratories
Neutral
387
-
7,024
1,781
2,044
14.1
15.0
9.4
10.5
41.4
36.8
8.8
8.3
0.2
0.2
4.2
3.6
Linc Pen & Plastics
Neutral
247
-
366
420
462
9.3
9.3
15.3
17.1
16.2
14.5
2.7
2.8
16.9
19.5
0.9
0.8
M M Forgings
Neutral
854
-
1,030
542
642
20.1
21.0
41.6
56.8
20.5
15.0
2.8
2.4
0.1
0.2
2.3
2.0
Mirza International
Neutral
170
-
2,043
1,148
1,285
18.0
18.0
8.0
9.4
21.1
18.2
3.5
3.0
16.3
16.1
1.9
1.7
Navkar Corporation
Buy
189
265
2,699
561
617
41.5
41.5
11.5
12.7
16.4
14.9
1.7
1.6
10.5
10.4
5.5
4.8
Nilkamal
Neutral
1,606
-
2,396
2,317
2,525
11.4
11.1
96.0
105.0
16.7
15.3
2.8
2.5
0.2
0.2
1.0
0.9
Stock Watch
November 02, 2017
Company Name
Reco
CMP
Target Mkt Cap
Sales ( Čcr )
OPM(%)
EPS (Č)
PER(x)
P/BV(x)
RoE(%)
EV/Sales(x)
(Č)
Price ( Č)
( Č cr )
FY18E FY19E FY18E FY19E FY18E FY19E FY18E FY19E FY18E FY19E FY18E FY19E FY18E FY19E
zOthers
Parag Milk Foods
Neutral
268
-
2,257
1,987
2,379
7.6
9.0
12.4
18.3
21.6
14.7
3.1
2.7
8.2
13.2
1.3
1.1
Radico Khaitan
Neutral
214
-
2,855
1,811
1,992
13.2
13.2
8.1
8.8
26.5
24.4
2.7
2.9
10.1
12.0
1.9
1.7
Relaxo Footwears
Neutral
599
-
7,197
1,981
2,310
13.7
14.5
12.0
15.5
49.9
38.7
9.7
7.9
0.2
0.2
3.7
3.2
Siyaram Silk Mills
Accumulate
593
650
2,781
1,769
1,981
12.7
12.7
22.6
26.2
26.2
22.6
4.1
3.5
15.5
15.5
1.8
1.6
Styrolution ABS India* Neutral
965
-
1,697
1,800
1,980
8.0
8.1
42.0
46.2
23.0
20.9
2.6
2.3
0.1
0.1
1.1
1.0
Surya Roshni
Neutral
372
-
1,631
4,870
5,320
7.7
7.8
22.8
28.1
16.4
13.2
2.2
1.9
0.1
0.1
0.6
0.5
TVS Srichakra
Neutral
3,204
-
2,453
2,729
2,893
12.7
12.5
248.5
265.0
12.9
12.1
3.7
3.0
0.3
0.3
0.9
0.8
Visaka Industries
Neutral
661
-
1,050
1,104
1,214
12.1
12.6
31.0
37.9
21.3
17.5
2.6
2.3
0.1
0.1
1.2
1.1
VIP Industries
Neutral
288
-
4,068
1,450
1,693
10.4
10.5
6.5
7.8
44.0
36.9
9.3
8.1
21.1
22.1
2.8
2.4
Navin Fluorine
Neutral
735
-
3,623
945
1,154
22.4
22.6
28.7
34.8
25.6
21.1
4.2
3.6
-
-
3.4
2.6
Source: Company, Angel Research; Note: *December year end; #September year end; &October year end; Price as on November 01, 2017
Market Outlook
November 02, 2017
Research Team Tel: 022 - 39357800
DISCLAIMER
Angel Broking Private Limited (hereinafter referred to as “Angel”) is a registered Member of National Stock Exchange of India
Limited,Bombay Stock Exchange Limited and Metropolitan Stock Exchange Limited. It is also registered as a Depository Participant with
CDSL and Portfolio Manager with SEBI. It also has registration with AMFI as a Mutual Fund Distributor. Angel Broking Private Limited is a
registered entity with SEBI for Research Analyst in terms of SEBI (Research Analyst) Regulations, 2014 vide registration number
INH000000164. Angel or its associates has not been debarred/ suspended by SEBI or any other regulatory authority for accessing
/dealing in securities Market. Angel or its associates/analyst has not received any compensation / managed or
co-managed public offering of securities of the company covered by Analyst during the past twelve months.
This document is solely for the personal information of the recipient, and must not be singularly used as the basis of any investment
decision. Nothing in this document should be construed as investment or financial advice. Each recipient of this document should make
such investigations as they deem necessary to arrive at an independent evaluation of an investment in the securities of the companies
referred to in this document (including the merits and risks involved), and should consult their own advisors to determine the merits and
risks of such an investment.
Reports based on technical and derivative analysis center on studying charts of a stock's price movement, outstanding positions and
trading volume, as opposed to focusing on a company's fundamentals and, as such, may not match with a report on a company's
fundamentals. Investors are advised to refer the Fundamental and Technical Research Reports available on our website to evaluate the
contrary view, if any.
The information in this document has been printed on the basis of publicly available information, internal data and other reliable
sources believed to be true, but we do not represent that it is accurate or complete and it should not be relied on as such, as this
document is for general guidance only. Angel Broking Pvt. Limited or any of its affiliates/ group companies shall not be in any way
responsible for any loss or damage that may arise to any person from any inadvertent error in the information contained in this report.
Angel Broking Pvt. Limited has not independently verified all the information contained within this document. Accordingly, we cannot
testify, nor make any representation or warranty, express or implied, to the accuracy, contents or data contained within this document.
While Angel Broking Pvt. Limited endeavors to update on a reasonable basis the information discussed in this material, there may be
regulatory, compliance, or other reasons that prevent us from doing so.
This document is being supplied to you solely for your information, and its contents, information or data may not be reproduced,
redistributed or passed on, directly or indirectly.
Neither Angel Broking Pvt. Limited, nor its directors, employees or affiliates shall be liable for any loss or damage that may arise from
or in connection with the use of this information.